
Reports
Digital Asset Market - Q1 in Review
Reports
Digital Asset Market - Q1 in Review


Q1 2026 was a tale of two halves. The first two months traded on AI disruption, software sector dispersion and a mechanically driven crypto deleveraging event; the final weeks were defined by the Iran war, the closure of the Strait of Hormuz and the oil and inflation shock that followed. The quarter ended with U.S. equities posting their worst quarter since 2022. The S&P 500 finished down roughly 5%, the Nasdaq approximately 8% and Brent crude up nearly 90%. Meanwhile, central banks have been caught between a rock and a hard place, as the risk of a stagflationary regime rises with the duration of the conflict.
Sentiment entering Q2 is cautious. The base case remains a negotiated resolution and gradual reopening of the Strait, consistent with the U.S. President’s most recent public remarks, under which oil retraces from panic highs, rate-cut expectations are partially restored and markets can refocus on earnings, valuations and AI capex – a path that would favour risk assets and long-duration bonds. Tail risk, however, is uncomfortably wide: prolonged conflict, U.S. ground involvement or any attempt to disable Kharg Island could produce a durably stagflationary regime. Until the distribution of geopolitical outcomes narrows materially, preserving flexibility and a higher cash allocation remains the more prudent posture.
Macro & Market Backdrop: From AI Dispersion to Oil Shock
January still looked like a late-cycle resilience month: U.S. and European equities rose, the Dow Jones touched all-time highs and the VIX spiked only briefly toward 20 before normalising. February introduced sharper stress, concentrated in AI-adjacent technology: the S&P 500 software and services index fell 4.6%, logging its seventh consecutive weekly loss, as investors worried that new AI tools could undermine legacy software business models. The broader market held its ground, however, and European indices held up better still. What the first two months of the quarter had in common was dispersion - rotation and fear within an overall bull market, but not a systemic de-rating.
That picture changed decisively in late March. The outbreak of the Iran war and growing market conviction that the Strait of Hormuz - which handles roughly 20% of global oil and LNG transport - faced a realistic risk of prolonged disruption sent Brent crude to $118/bbl at its peak, a gain of approximately 90% over the quarter. Europe’s gas prices nearly doubled and Japan’s Nikkei, acutely sensitive to energy import costs, fell almost 13%. The White House’s equivocal signalling, balancing the risk of an election-year oil spike against the imperative to project strength and achieve its geopolitical goals, kept volatility elevated throughout March, as the endgame remained unresolved. Kharg Island, Iran’s principal export terminal, emerged as the focal point for tail-risk analysis: any move to seize or disable it would shift the conflict from shipping disruption to a direct assault on export capacity, a materially more inflationary and escalation-prone scenario.
The energy shock fed through to prices quickly. AAA gasoline rose above $4/gallon for the first time in over three years, euro area inflation moved to 2.5% in March from 1.9% in February (energy up nearly 5%), and IMF commentary flagged a potential 15–20% rise in fertilizer prices if the conflict persists. 10-year Treasury yields rose approximately 40 basis points month-over-month to nearly 4.5%, while Gilt yields climbed almost 70 basis points to nearly 5%, reflecting the UK’s acute energy sensitivity. The OECD revised its U.S. inflation forecast from 2.8% to 4.2% for 2026, briefly pushing markets to price a Fed hike as the most likely next move. US Fed Chair Powell’s response was instructive: tightening into an energy shock risks compounding growth damage long after the inflationary impulse fades. In other words, it is the “stag” part of the equation that policymakers are currently more worried about. The “flation” part becomes more relevant only if the conflict drags on. For now, both – the ECB and the Fed – are treating the shock as a temporary supply disruption. An April hike appears unlikely, although markets have priced in a roughly 76% probability of a 25bp ECB move by June. Stocks and bonds fell simultaneously through March, producing the worst month for a 60/40 portfolio since September 2022. The US Dollar was one of the only reliable safe haven for an international portfolio, gaining even against the Swiss franc. Gold and top-grade corporate bonds offered no shelter.
Equities bore the full weight of the reset in March. The Nasdaq fell nearly 11% from its late-October record high, the Dow entered correction territory and all of the Magnificent Seven were hit, with Microsoft and Tesla each down more than 20% from their highs. Nvidia’s Q4 revenue of $68.1bn beat consensus, but in a fragile tape even strong earnings failed to restore confidence: by March 30 its PE ratio had fallen to a seven-year low and approximately $800bn of market value had been erased. Meta faced an additional and distinct headwind: a landmark product liability ruling - the first successful case of its kind - raised the prospect of systemic legal exposure for social media platforms and drew comparisons to the “tobacco moment” that preceded structural litigation risk for that industry.Private credit told a parallel story. BlackRock and Blackstone both limited withdrawals from flagship semi-liquid funds following surges in redemption requests. By late March some banks had begun tightening lending conditions. After high-profile corporate collapses in recent months, including Tricolor and FirstBrand, credit quality in underlying portfolios will be closely watched. While parallels to 2007 were quickly drawn, we believe that the asset class, now approximately $2 trillion post-Basel III, is better described as experiencing contained stress rather than systemic crisis. However, the structural mismatch between illiquid assets and quarterly redemption windows, compounded by embedded leverage, will be tested further if conditions deteriorate.
VIX Index Price (in USD)
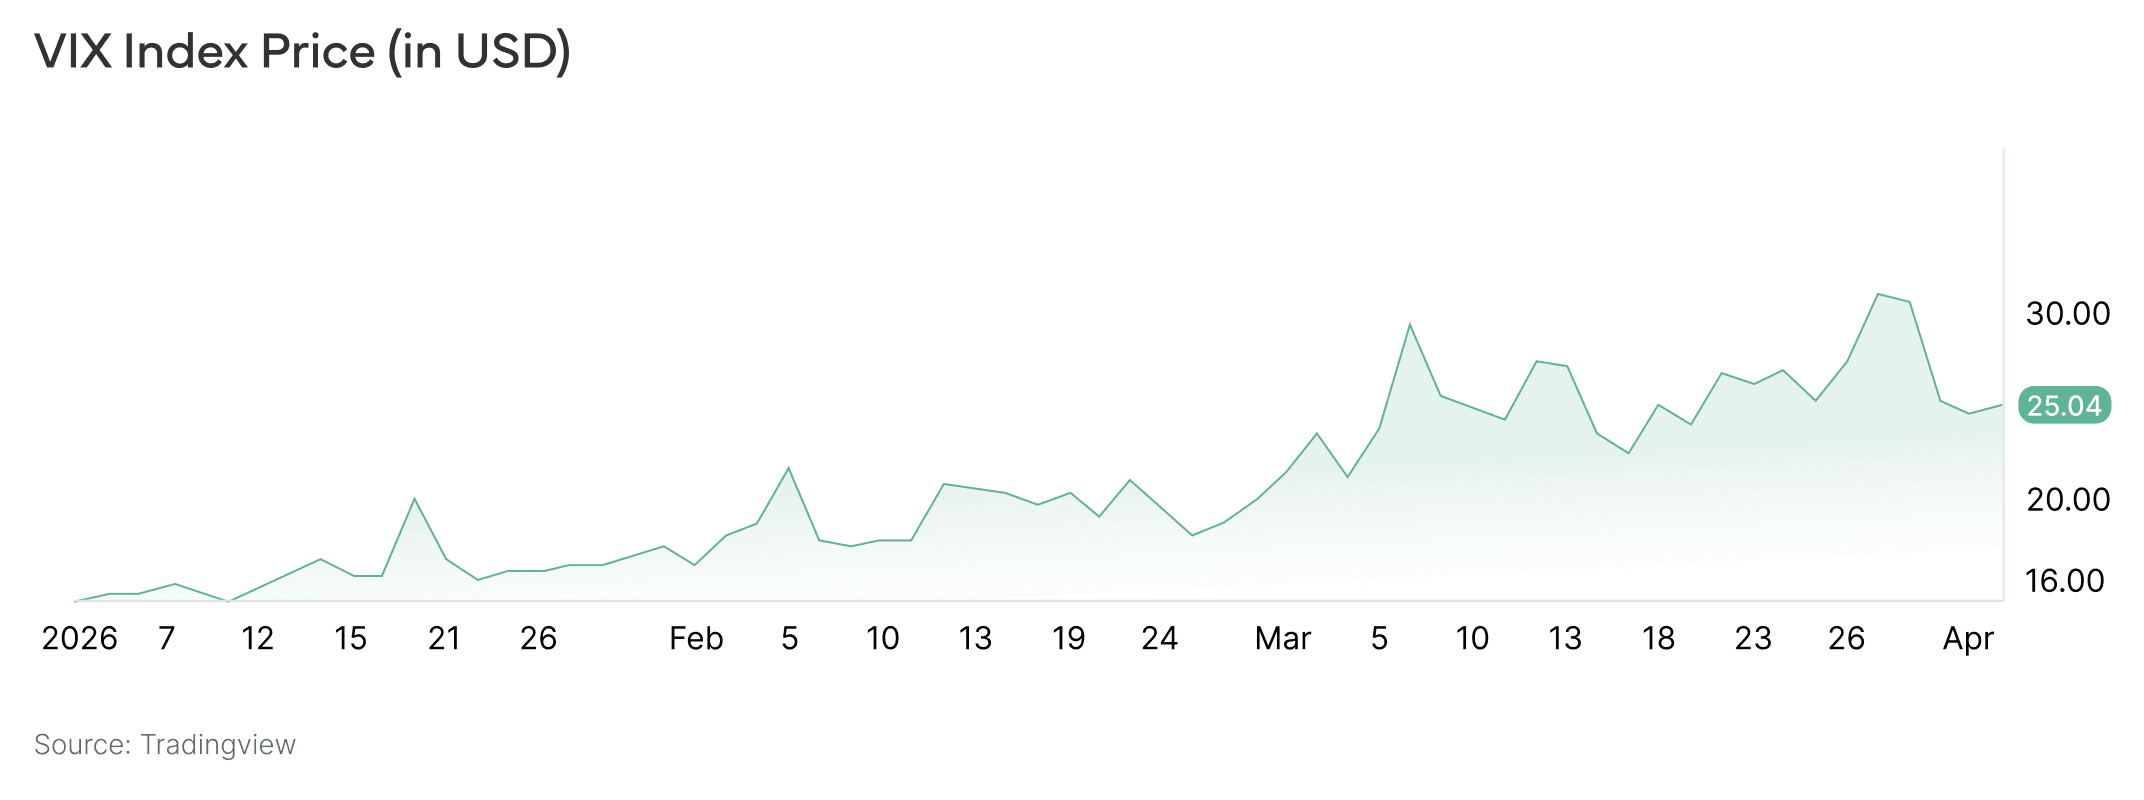
The VIX index has hit its highest level since liberation day in March and traded consistently above 20 over the month as uncertainty around the war dominated the headlines.
Brent Crude Oil Price (in USD)
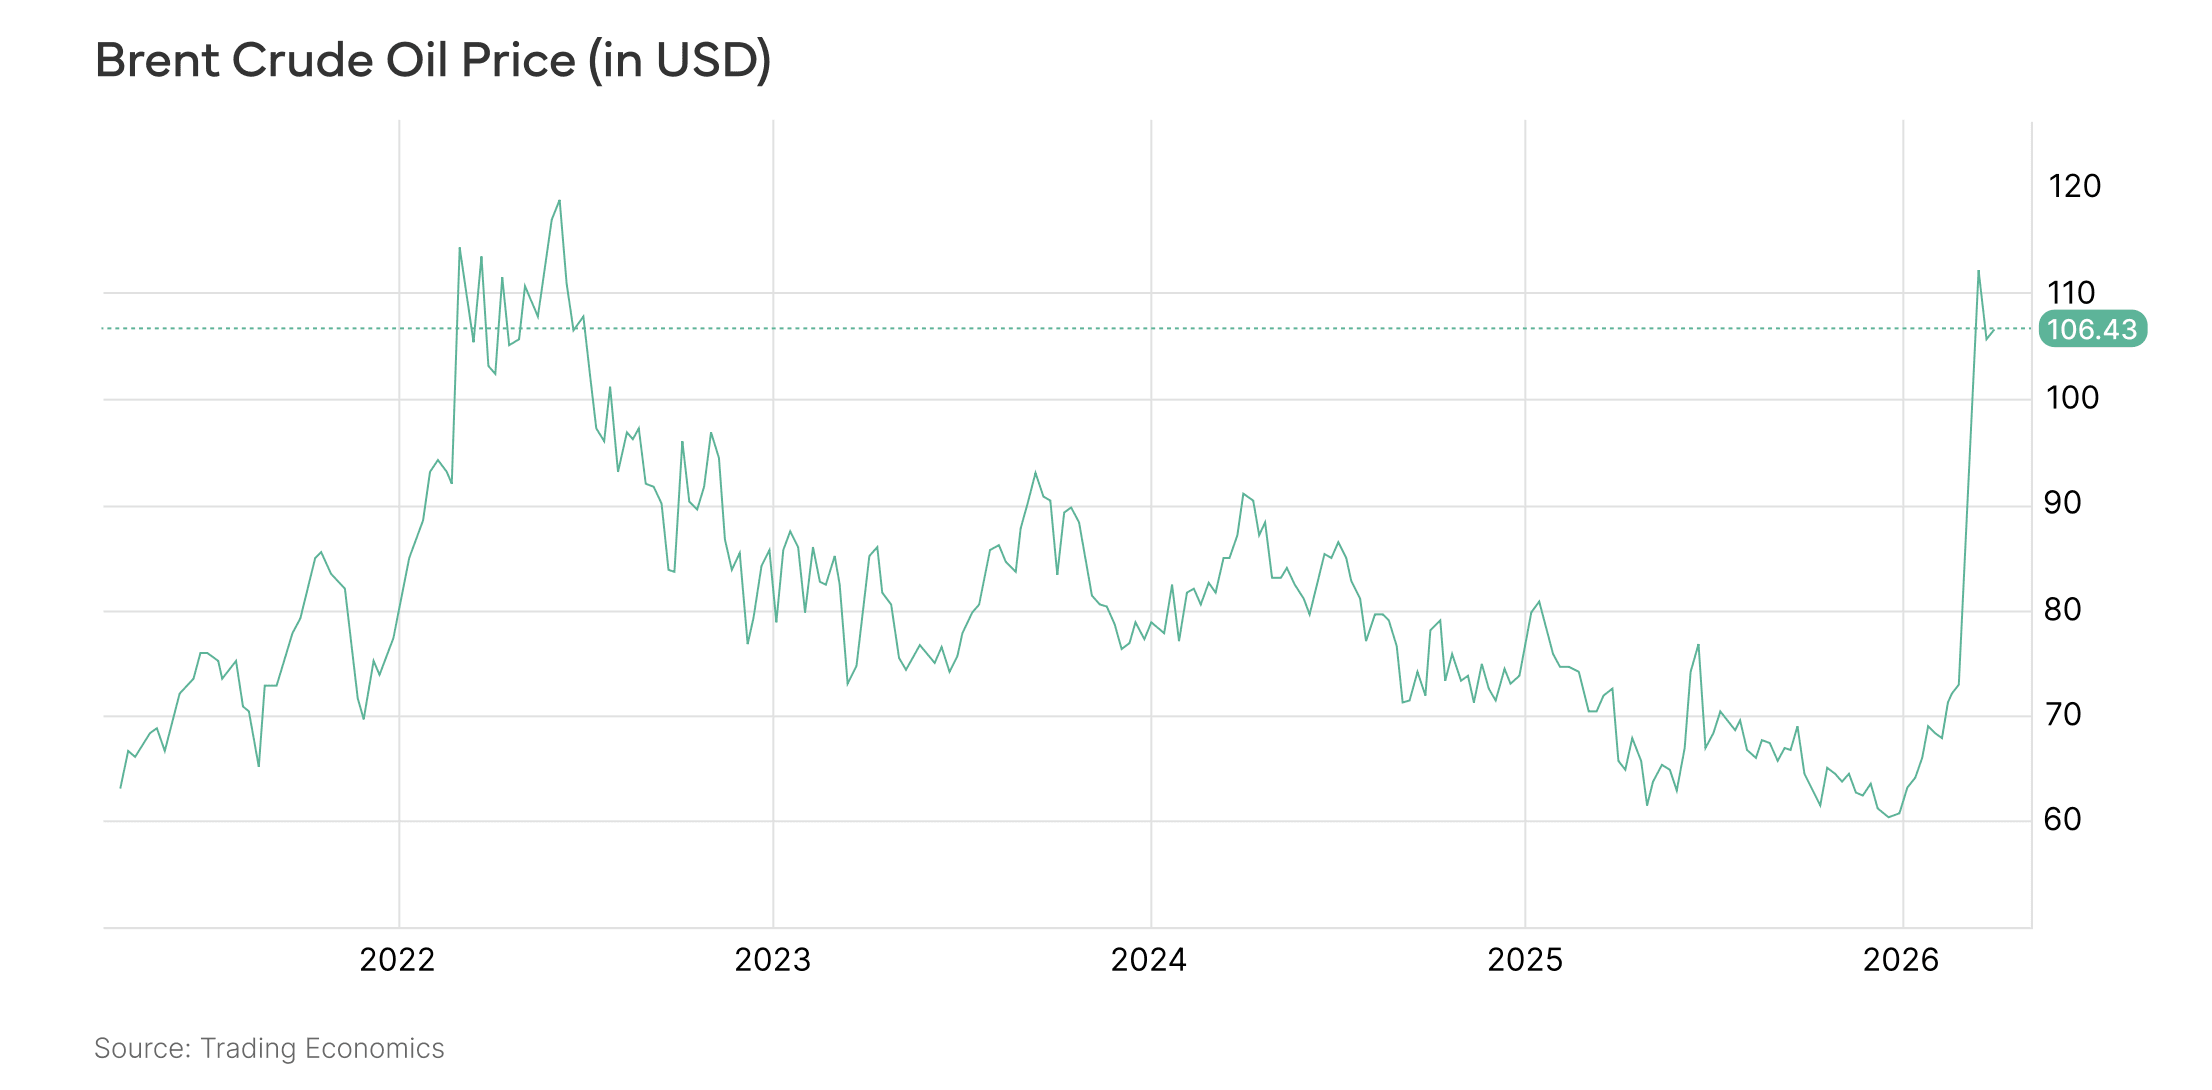
Brent has increased by more than 65% since the outbreak of the Iran war and reached its highest level since Russia’s invasion of Ukraine.
Digital Assets
Bitcoin entered 2026 near $87,500 and declined progressively through the quarter. The defining event came on February 5: BTC fell from roughly $70,700 to $60,000 intraday, a 15% move representing a 6.4 standard deviation event comparable in magnitude only to March 2020. More than 500 accounts were liquidated on Deribit, deep out-of-the-money puts repriced 20–50x within hours, and the Deribit DVOL index surged from approximately 55 to 90 in six hours. ETF flow data confirmed the move was predominantly mechanical amplified by cross-asset deleveraging by some large multi-strategy hedge funds, rather than any fundamental deterioration. Bitcoin subsequently rallied to approximately $75,000 as the Iran conflict broke out, before settling near $66,300 at quarter-end, leaving it roughly 24% lower year-to-date. Ethereum underperformed more significantly, falling approximately 30% from January’s open to settle near $2,026.
The quarter left the market structurally cleaner. BTC options open interest fell from approximately $57bn in October 2025 to around $28bn by January and continued to contract. Funding rates stayed subdued and ETH funding briefly turned negative. This deleveraging explains BTC’s relative resilience during the Iran breakout: despite the scale of the oil shock and the Nasdaq’s double-digit decline, BTC fell only approximately 11% from its $75,000 local high, as lighter positioning and a defensive options skew provided less mechanical overhang to unwind than in prior stress episodes. Technically, BTC spent much of Q1 in corrective but not fully broken territory, holding around or above its 200-day moving average and transitioning from trend to base-building rather than entering a new structural downtrend. The 25-delta skew stayed negative through most of the period and puts remained more expensive than calls across the surface, indicating a market hedging downside, not chasing upside. Entering Q2, the asset class is lower-beta and less euphoric than it was at the October 2025 peak: not a safe haven, but meaningfully less vulnerable to reflexive liquidation cascades.
Regulation remained a secondary driver in Q1 but the tone was constructive at the margin. In the U.S., attention continued to focus on the CLARITY Act and related market-structure proposals. The practical takeaway is incremental clarity rather than immediate regime change. In Europe, MiCA shifted from theory to implementation. The relevant question for institutional adoption is no longer whether a framework exists, but how burdensome licensing, supervision and capital requirements prove in practice.
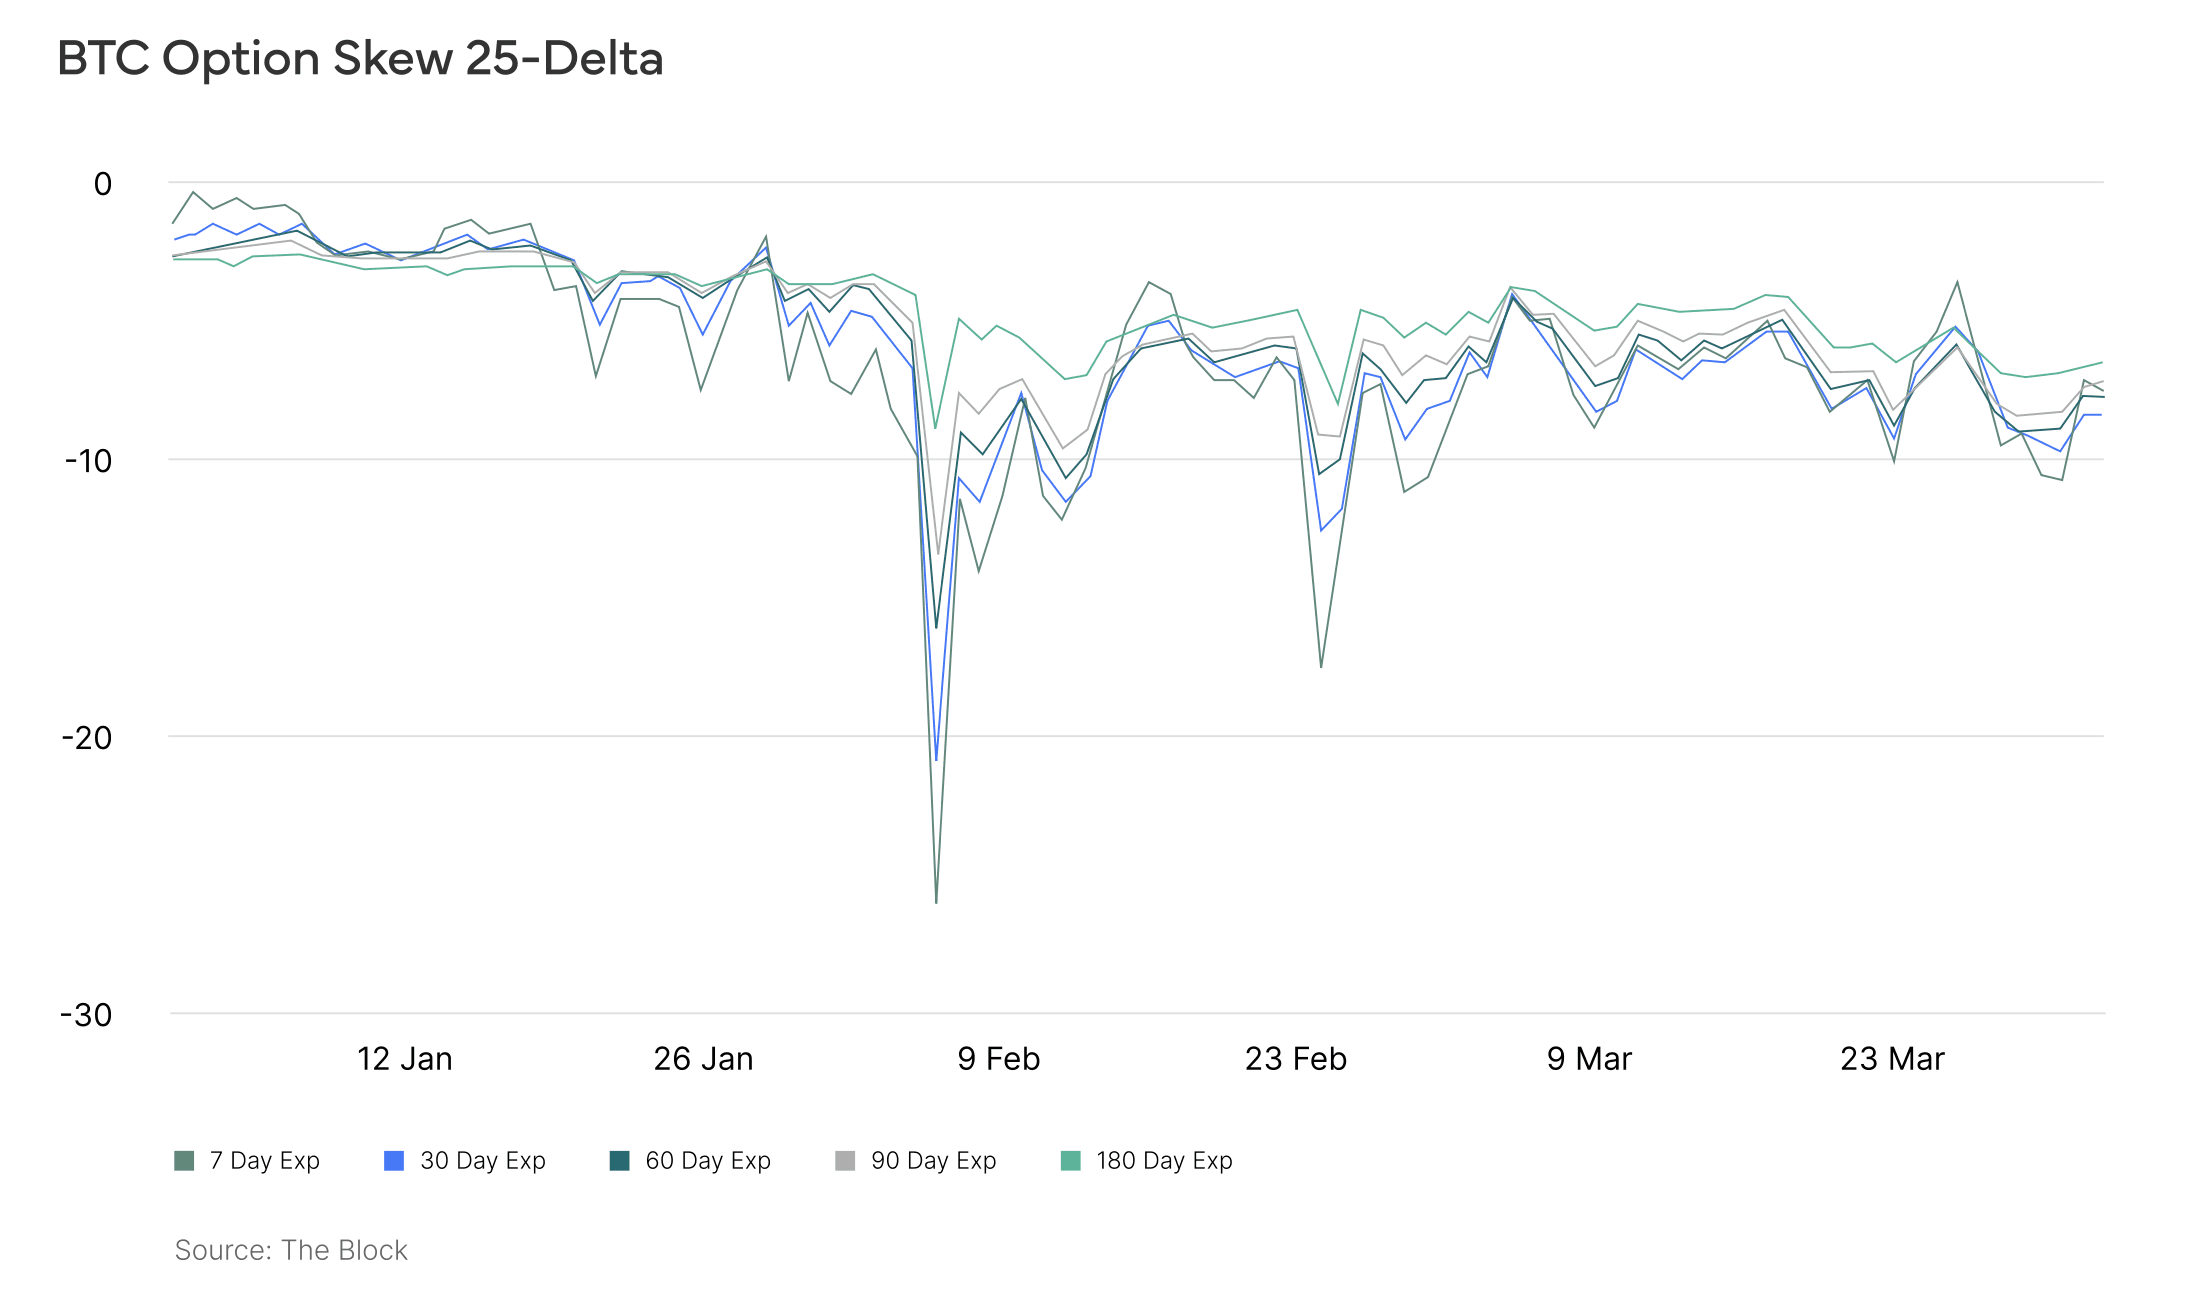
BTC option skew still indicates preference for puts over calls, reflecting an overall cautious environment in digital assets.
Closing Thoughts
The central question entering Q2 is not whether markets are cheap or expensive, but how wide the range of outcomes remains. If the Strait of Hormuz reopens on a predictable timeline, the dominant market narrative around AI capex, rate cuts and digital asset adoption can reassert itself relatively quickly. Positioning is clean across risk assets, oversold conditions are widespread, valuations have largely mean-reverted and the structural tailwinds are still intact. However, if the conflict drags on, the stagflationary feedback loop between energy prices, inflation expectations and credit stress will intensify.
Within digital assets, the washout in leverage and speculative excess since October 2025 means the asset class does not need a strong macro tailwind to recover. It needs only the removal of the most acute headwinds. In this environment, it usually does not take much to build momentum for a new bull phase.
Disclaimer:
Investment advisory and asset management services are provided by Lionsoul Global Advisors LLC (“Lionsoul Global Advisors”), an investment adviser registered with the Texas State Securities Board (CRD #: 324883). Information presented, displayed, or otherwise provided is for educational purposes only and should not be construed as investment, legal, or tax advice, or an offer to sell or a solicitation of an offer to buy any interests in a fund or other investment product. Access to the products and services of Lionsoul Global Advisors is subject to eligibility requirements and the definitive terms of documents between potential clients and Lionsoul Global Advisors, as they may be amended from time to time.
Past performance is not indicative of future results, and there can be no assurance that the portfolio will achieve its investment objectives or that any investment strategy will be successful. Certain statements contained herein constitute forward-looking statements, including statements regarding anticipated market conditions, portfolio positioning, and expected opportunity sets. Such statements involve known and unknown risks, uncertainties, and other factors that may cause actual results to differ materially from those expressed or implied. Forward-looking statements speak only as of the date made and are subject to change without notice.